Lineage as an Audit Weapon: Two Audit Trails and the Dataset Boundary
We audited the FM-WS-02 writeback from the lineage side and found the doctrinal spine of Foundry governance: there are two audit trails and they do not overlap. Monocle (Data Lineage) covers data up to the dataset boundary and then stops; asking it for downstream artifacts answers, verbatim, No related artifacts found. Everything past that boundary, ontology objects, Workshop apps, and every object edit, is audited in Ontology Manager: the Datasources tab's Object edits history, verbatim Store object edits history for compliance and traceability. The enriched dataset's tooltip reads up-to-date and its History shows exactly one snapshot transaction from Aug 29 with zero jobs after, while the WS-02 writeback changed objects days later. Dataset freshness says nothing about object-layer state. Then the accidental payoff: on the branch with the FM-GV-01 pump policy active, the Work Order header reads 13 objects instead of 66, and ontology SQL returns exactly one group, n=11, assetType=pump, matching the FM-PB-01 source CSV ground truth of 11 closed pump rows. Header and query disagreed at capture time (13 versus 11, likely reindex lag); trust the query during the reindex window. Six field repairs, including the empty Usage tab that must never be used for impact analysis.
- FM-GV-01. The pump policy whose live effect this module captures from the audit side. Do it first.
- FM-WS-02. The writeback this module audits: an object edit that dataset history will swear never happened.
Field notes from the Avinyr lab. Everything below was observed live on 2026-09-08 in Data Lineage (the Monocle app) and Ontology Manager on our cloud enrollment, in the same session block as FM-GV-01 and on our shared lab branch. The subject is real: the dataset work_orders_closed_enriched (ri.foundry.main.dataset.4ba2d096-65c8-492f-8ed5-7471ee473df4), the Work Order object type built on it in FM-ON-01, and the writeback FM-WS-02 executed days after the data last moved. Every screenshot is ours.
[ READ THIS FIRST: WHAT THIS MODULE IS ]
This is an audit module, not a lineage tutorial. The question it answers is the one an auditor, a regulator, or your own incident review will eventually ask: prove where every number came from, and prove what changed it. We followed the "Explore lineage" link that FM-GV-01 noted and did not open, and we walked it until it ran out. It ran out at a specific, quotable place: the dataset boundary.
The doctrinal spine is one finding. Foundry has two audit trails and they do not overlap. Monocle, the Data Lineage app, covers data up to the dataset boundary and then stops. Everything past that boundary, the ontology objects, the Workshop apps, and every object edit, is audited somewhere else: in Ontology Manager, on the Datasources tab, under Object edits history. If you audit with one tool, you have audited half the system and do not know it.
[ WHAT YOU WILL HAVE AT THE END ]
A walked lineage graph, work_orders_raw to work_orders_closed_enriched to assets, with the exact spot where it stops telling you the truth. The verbatim toast the platform answers when you ask what consumes a dataset downstream: "No related artifacts found". A History panel showing one build, ever, while the object layer moved on without it. The real writeback audit trail, Object edits history, found and read end to end on the Work Order type. And one live governance payoff we did not plan: the FM-GV-01 pump policy, seen from the audit side, cutting the Work Order header from 66 objects to 13, with ontology SQL proving the real count is 11 and the ground-truth CSV agreeing.
| What you might expect | What Foundry actually does |
|---|---|
| Lineage shows everything built on a dataset | Monocle shows datasets only. Clicking Artifacts on the downstream expand returns, verbatim: "No related artifacts found". Ontology objects, Workshop apps, and object edits are not in the graph |
| A dataset tooltip reading "up-to-date" means the system is current | The WS-02 writeback edited objects days after the last transaction. The dataset is "up-to-date" while the object layer has moved on. Freshness says nothing about object-layer state |
| Object edits appear in the dataset's history | History shows exactly one snapshot transaction, Aug 29, and zero jobs for Sep 1 to Sep 8. The writeback audit trail lives in Ontology Manager, not here |
| The Usage tab tells you what depends on an object type | Verbatim: "No usage for the last 30 days", despite two Workshop apps built on this object type in the past week. Never use it for impact analysis |
| A security policy is a config detail until a user complains | On the branch, the policy is already filtering what the ontology owner sees: header 66 -> 13, and SQL returns exactly the 11 pump objects, matching the source CSV |
[ STEP 1: THROUGH THE EXPLORE LINEAGE DOOR ]
Start where FM-GV-01 stopped: the dataset page in Compass, Details > About, top right of the panel, the "Explore lineage" link. It opens the Monocle app at /workspace/monocle/graph/datasets/
One navigation trap, reported because it will get you: the canvas opens blank. The graph exists; it is just not in the viewport. The bottom-left icon stack carries Toggle minimap, Zoom in, Zoom out, and the one you need, Zoom to fit. One click and the graph appears: work_orders_raw -> work_orders_closed_enriched.
The right panel's About for the enriched node is the provenance block you already know from FM-GV-01's Step 7: Updated Aug 29 2026 8:00 PM, Created Aug 29 2026 7:59 PM by Yousuf Zakhel, 12 columns, 66 rows, 2 files, 505KB, Updated via FM-PB-01 first pipeline with AIP, Inputs: work_orders_raw. Hold onto that Aug 29 timestamp. It is the last time data moved, and the rest of this module is about what that does and does not mean.

[ STEP 2: WHERE THE GRAPH STOPS ]
Click the downstream chevron on work_orders_closed_enriched. The chain extends one node: assets, the FM-ON-01 assets lookup dataset (Updated Sep 5 2026 4:19 PM, 3 columns, 66 rows, 522KB, Updated via FM-ON-01 assets lookup, Inputs: work_orders_closed_enriched). An expand popup offers three options: "Datasets (1)", "Artifacts", "Collapse all".

That popup is the moment the doctrine reveals itself. "Datasets (1)" is the assets node we just added. "Artifacts" is the question an auditor actually asks: what consumes this dataset? Ontology object types, Workshop apps, the things the business touches. We clicked Artifacts. The platform answered with a toast, verbatim: "No related artifacts found".

The answer is false in any operational sense. The Work Order and Asset object types are backed by this dataset. Two Workshop apps, the FM-AIP-01 work order triage and the FM-AIP-02 maintenance triage desk, read those objects. FM-WS-02 proved object edits flow through a Workshop action. None of that is in Monocle. The lineage graph covers data up to the dataset boundary and stops. "No related artifacts found" does not mean nothing consumes your data. It means you are asking the wrong audit trail.
[ STEP 3: UP-TO-DATE LIES BY OMISSION ]
Hover the work_orders_closed_enriched node. The tooltip, verbatim: "Last new data Sat, Aug 29, 2026, 8:00 PM (up-to-date)", 505KB, 2 files, 66 rows, 12 columns.

Read "(up-to-date)" the way an auditor would. Between Aug 29 and this session, the FM-WS-02 writeback executed: a real object edit through a real Workshop action, green toast, persisted across a reload. The object layer moved. The dataset did not, because writeback writes to the ontology's edit store, not to a new dataset transaction. So the tooltip is technically accurate and operationally misleading. Dataset freshness says nothing about object-layer state. If your audit question is "did anything change since Aug 29", this tooltip will answer no while the honest answer is yes, in a different store.
The History panel confirms the shape of the silence. With the node selected, the bottom bar offers Preview, SQL scratchpad, History, Code, Build timeline, and Data health. Open History: exactly one transaction, verbatim "Aug 29, 8:00 PM, Snapshot, Yousuf Zakhel, Part of Build +1 job, (37s)", plus "master created". Job metrics for Sep 1 to Sep 8 2026: 0 Total jobs, 0 Succeeded, 0 Failed, 0 Canceled, "-" Median duration. The chart message, verbatim: "There are no jobs of the selected job type and date range for this dataset." A "Force snapshot" button exists, unused.
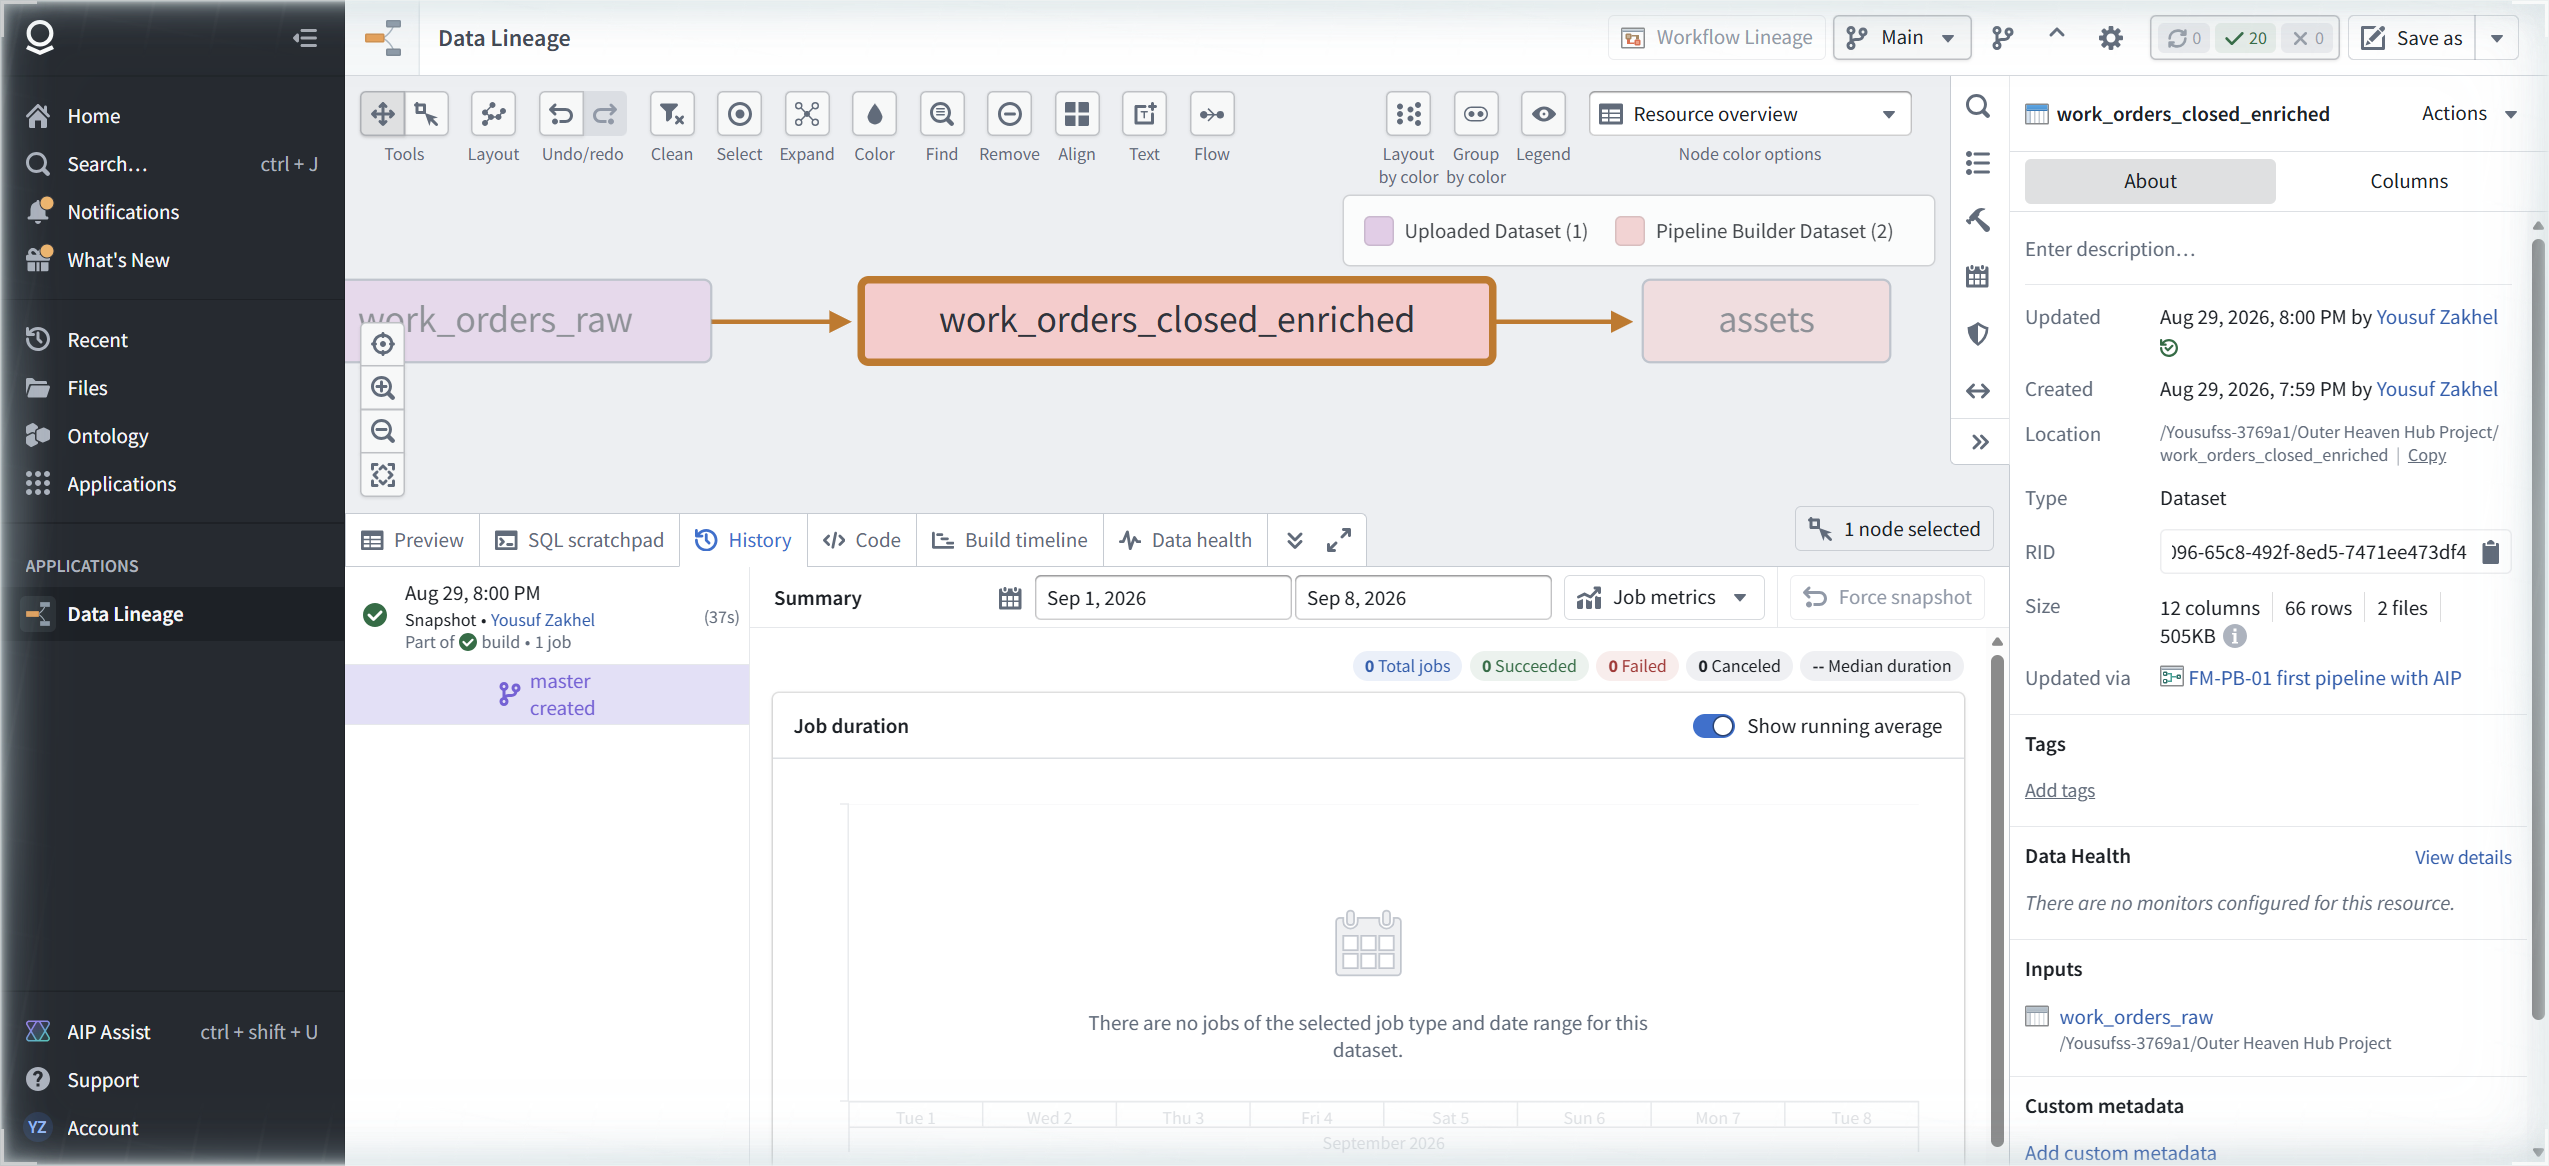
One build, ever. Everything that happened to the data after Aug 29, the ontology edits, does not exist as far as dataset history is concerned. Monocle is not hiding it. Monocle cannot see it. That is the boundary.
[ STEP 4: THE OTHER AUDIT TRAIL ]
Now the second trail. Ontology Manager, Work Order object type, Datasources tab, on our shared lab branch. The top reads: "Backing datasource: work_orders_closed_enriched ... The datasource is required, but can be changed." A Replace button, an "Add new backing datasource" link. Below, the Edits section: "Allow edits" ON, with the warning, verbatim: "Disabling edits will not remove existing edits".
Then the line this module exists for. "Object edits history", badge "Ready", verbatim: "Store object edits history for compliance and traceability". Below it, "Enable object edit history" ON, verbatim: "Initialization takes several minutes. During this time, edits and actions are temporarily disabled. Once enabled, display object edit history in Workshop and other applications." And one switch left OFF: "Store all properties", verbatim: "By default only edited properties are stored; enable to store all properties for full traceability."
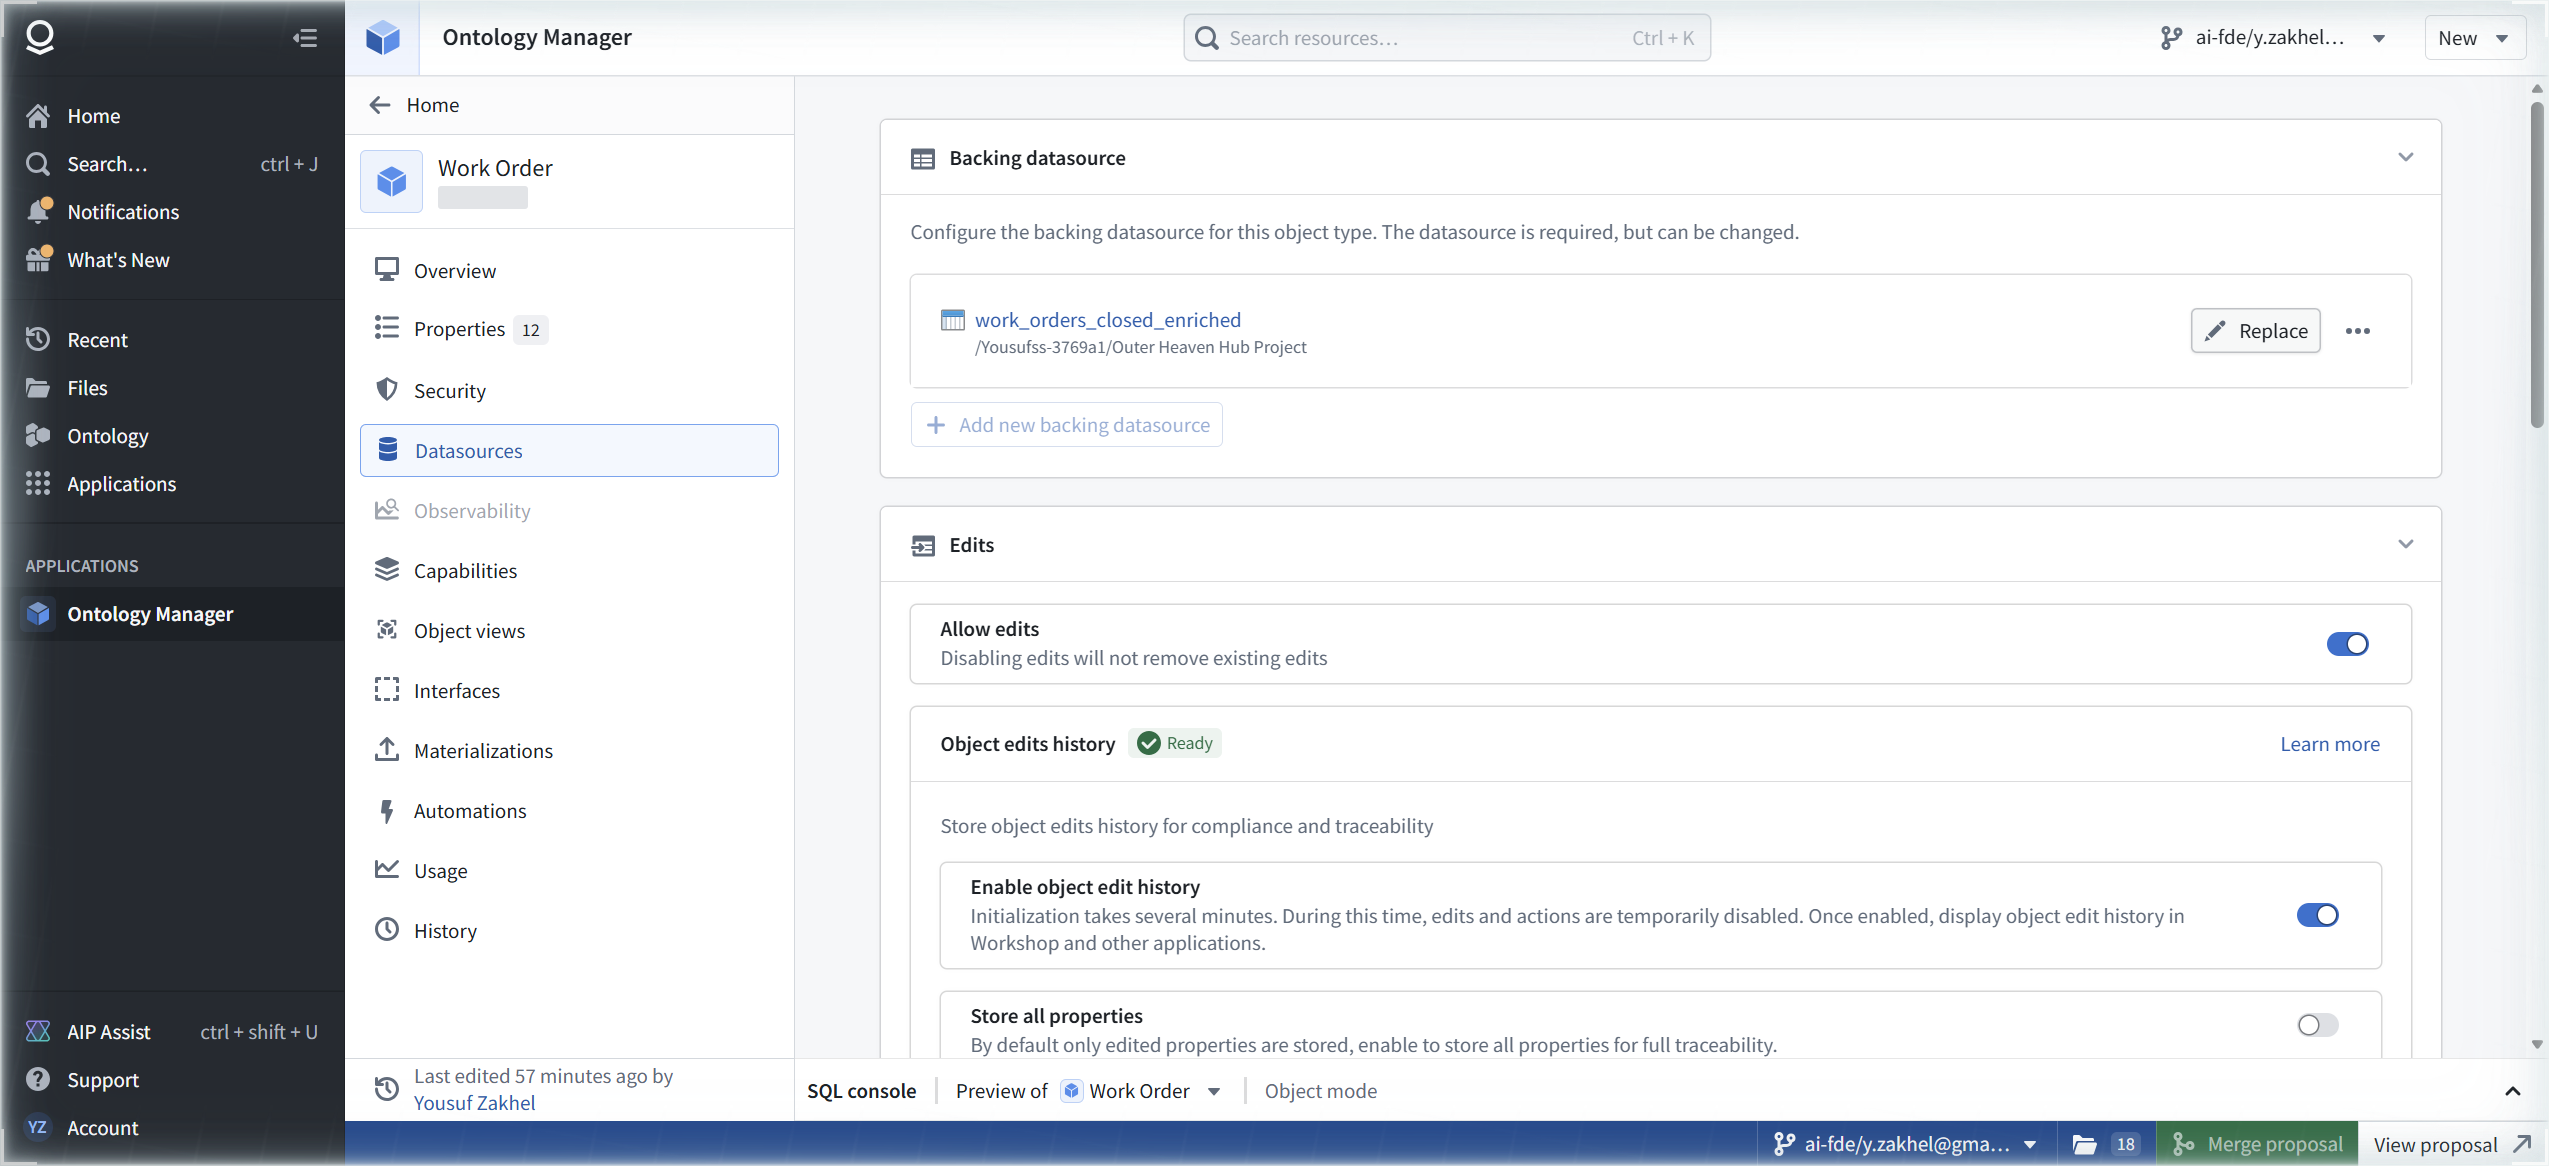
This is where the WS-02 writeback is audited. Not in Monocle, not in dataset history. Here. Three operational facts to carry out of this panel. First, edit history was already enabled on this object type, badge Ready, from the FM-ON-02 edits gate work; it is a configuration, not a default you can assume on every type. Second, enabling it costs several minutes during which edits and actions are disabled; plan that window, do not discover it in production. Third, the default stores only edited properties. If your compliance bar is full traceability, "Store all properties" is the switch, and it is off by default.
Two audit trails, then, and the audit discipline they demand: Monocle for data lineage up to the dataset boundary, Ontology Manager's object edits history for everything past it. Neither overlaps the other. A complete audit walks both.
[ STEP 5: THE USAGE TAB WILL NOT SAVE YOU ]
While in Ontology Manager, we checked the surface an operator would naturally trust for impact analysis: the Usage tab. Its entire content, verbatim: "No usage for the last 30 days. Information about how and where this object type is being used will soon be available here." Plus shortcuts: Workshop app (Create new), Object View (Configure), Quiver analysis (Create new).

This object type has two Workshop apps built on it in the past week, FM-AIP-01 and FM-AIP-02. The Usage tab shows nothing. Do not rely on it before a change. Impact analysis on this enrollment means knowing what you built, or walking the ontology and the project manually. The tab promising to tell you is, today, an empty state with a "soon" in it.
[ STEP 6: THE GV-01 PAYOFF, SEEN FROM THE AUDIT SIDE ]
We did not plan this finding; it walked into the screenshot. Look at the Work Order header in that same Usage capture: "13 objects". Before the FM-GV-01 policy was saved, that header read "66 objects" (GV-01 screenshot 11). The granular security policy, Asset Type is equal to pump, saved to our shared lab branch, is already filtering what the ontology owner sees on the branch. The access boundary FM-GV-01 drew in the Test policies simulator is visible in the wild, in a count.
Trust, but verify with the query engine. The bottom bar in Ontology Manager carries a SQL console, pre-populated with SELECT * FROM the object type's RID. The editor is Monaco. One warning carried over from FM-PB-01, and it applies here too: the results grid is canvas-rendered. You cannot scrape the cells out of the DOM. Read values visually, or capture the API response. Same lesson as the FM-PB-01 preview grid, new surface.
The SELECT * preview showed pump in every visible assetType cell. Then the ground-truth query:
SELECT COUNT(*) AS n, assetType FROM ri.ontology.main.object-type.5d8c833a-1622-473c-959c-e9a0711ab687 GROUP BY assetType
Result: exactly one row. n=11, assetType=pump.

Now the ground truth. The FM-PB-01 source file, field-manual/labs/FM-PB-01/data/work_orders_raw.csv, has 120 rows: 66 closed (matching the enriched dataset's row count), and of those, exactly 11 closed pump rows. The policy-filtered ontology returns exactly the 11 pump objects. The rule does precisely what it says, on real data, against an independent count. FM-GV-01 proved the policy in a simulator before it bit anyone. This is the same policy, one step further: filtering live counts, verifiable against ground truth.
One honest discrepancy, logged and not explained away. The header said "13 objects" while the query returned 11. Likely cause: reindex lag. The FM-GV-01 review dialog warned that policies activate only after reindexing succeeds, and counts derived from different indexes can disagree while that settles. The operational rule for the reindex window: trust the query, not the header. The header is a cached view of an index in motion; the query is the policy evaluated against the object store.
[ FIELD REPAIRS ]
FR-1: Monocle stops at the dataset boundary. Symptoms: downstream expand offers "Artifacts"; clicking it answers, verbatim, "No related artifacts found", while ontology object types, Workshop apps, and object edits provably exist on this dataset. Cause: by design; Data Lineage tracks datasets, and the ontology layer is out of its scope. Fix: audit in two passes. Monocle for data lineage, Ontology Manager plus object edits history for the ontology. When "No related artifacts found" appears, hear it as "wrong tool", not as "nothing downstream". Evidence: 02-lineage-downstream-assets-expand-menu.png, 03-full-chain-no-related-artifacts.png.
FR-2: "up-to-date" lies by omission. Symptoms: node tooltip reads "Last new data Sat, Aug 29, 2026, 8:00 PM (up-to-date)" days after a real writeback changed objects on the backing object type. Cause: dataset freshness measures dataset transactions; writeback writes to the ontology edit store and produces no transaction. Fix: never read dataset freshness as object-layer state. For "did anything change", check object edits history on the Datasources tab. Evidence: 04-node-tooltip-last-new-data-aug29.png, 05-history-single-transaction-no-jobs.png.
FR-3: the writeback audit trail is Object edits history, and its default is partial. Symptoms: dataset History shows one snapshot, zero jobs after Aug 29; the writeback is invisible there. Cause: object edits are audited in Ontology Manager, Datasources tab, Edits section: "Store object edits history for compliance and traceability", badge Ready on our type. Fix: confirm "Enable object edit history" is ON before you need the trail (initialization takes several minutes and disables edits and actions during it), and decide explicitly on "Store all properties": default stores only edited properties; full traceability needs the switch. Evidence: 06-ontology-datasources-edits-history.png.
FR-4: the Usage tab is empty against real usage. Symptoms: "No usage for the last 30 days" on an object type with two Workshop apps built on it in the past week. Cause: the surface is unpopulated on this enrollment; the sentence itself says the information "will soon be available". Fix: do not use the Usage tab for impact analysis. Inventory consumers manually before any change to the object type. Evidence: 07-usage-tab-13-objects-policy-effect.png.
FR-5: header count and query disagree during the reindex window. Symptoms: Work Order header reads "13 objects" on the branch while SELECT COUNT(*) ... GROUP BY assetType returns exactly one group, n=11, pump. Cause: most likely reindex lag; the FM-GV-01 save dialog warned policies activate only after reindexing succeeds, and the header and the query engine read different state while it settles. Fix: during the reindex window, trust the query. Verify policy effect against ground truth (our CSV says 11 closed pump rows; the query says 11; the rule is correct), and re-check the header after the reindex completes. Evidence: 07-usage-tab-13-objects-policy-effect.png, 09-sql-count-11-pump.png.
FR-6 (process): Monocle and ontology result grids are canvas-rendered. Symptoms: result cells do not exist in the DOM; scripted scraping reads nothing. Cause: canvas rendering, same as the FM-PB-01 preview grid lesson. Fix: read values visually or capture the API response. Budget for this in any automation that audits query results.
[ FAQ ]
So which tool do I open when someone asks "who touched this"?
Both, in order. Monocle answers how the data got here: source, pipeline, build, transaction history. It stops at the dataset boundary. For anything an operator did to objects, edits through Workshop actions, the trail is Ontology Manager, Datasources tab, Object edits history. The complete answer is always two lookups.
Did the WS-02 writeback really leave no trace in the dataset?
None. History shows one transaction, the Aug 29 snapshot, and zero jobs for Sep 1 to Sep 8, with the platform's own chart message confirming the empty range. The write was real, proven by reload in FM-WS-02. It is simply audited in a different store. That is the point of the module: the dataset's silence is not evidence of no change.
Is object edit history on by default?
It was already on for our Work Order type, badge Ready, because the FM-ON-02 edits gate work enabled it. Do not generalize that. The toggle exists per object type, enabling it takes several minutes with edits and actions disabled, and "Store all properties" is off by default. Check the Datasources tab on every type you are expected to audit, before the audit is urgent.
Why did the header say 13 if the answer is 11?
We do not know for certain; logged, not explained. The working theory is reindex lag: the GV-01 dialog warned that policies activate only after reindexing succeeds, and the header count and the SQL engine can read different states while that completes. What we can say is which number was right. The CSV ground truth says 11 closed pump rows. The query said 11. The rule does what it says. Re-check the header after the reindex settles.
Does "No related artifacts found" ever mean nothing is downstream?
It means nothing Monocle can see. Our dataset feeds an object type, two Workshop apps, and a live writeback path, and the toast still fired. Treat the message as a scope statement about the tool, not a fact about your system.
[ NOT TESTED ]
- The SQL scratchpad, Code, Build timeline, and Data health tabs in Monocle's bottom bar (Preview and History only)
- "Force snapshot" on the History panel
- "Add new backing datasource" and the Replace flow on the Datasources tab
- Object edit history as displayed in Workshop and other applications (the enablement text promises it; we did not open the per-object view)
- "Store all properties" ON, and the storage cost of full traceability
- Whether the header count converges to 11 after the reindex fully settles (logged as the FR-5 follow-up)
- Quiver analysis from the Usage tab shortcut
- Lineage behavior on a branch: Monocle opened with branchId=master; what branchId set to our shared lab branch shows is unexplored
[ NET POSITION ]
The audit map is drawn, on camera. Foundry runs two audit trails that do not overlap: Monocle for data up to the dataset boundary, where the honest answer to "what consumes this" is a verbatim "No related artifacts found", and Ontology Manager's Object edits history for everything past it, where the WS-02 writeback actually lives. The two traps worth memorizing are freshness ("up-to-date" describes dataset transactions and says nothing about object-layer state) and usage (the Usage tab is an empty state; never run impact analysis off it). And the branch delivered an unplanned proof: the FM-GV-01 pump policy filtering live counts, 66 to 13 in the header, 11 in the query, 11 in the ground-truth CSV, with the header-to-query gap logged as reindex lag and the rule standing: during the reindex window, trust the query. Next in the track: the header convergence check, object edit history as operators see it in Workshop, and lineage from the branch's own perspective.